 TeamRally
How to Measure Employee Happiness (and What the Number Misses)
A practical guide to measuring employee happiness — choosing an instrument, writing questions that don't lie to you, setting cadence, and reading results honestly.
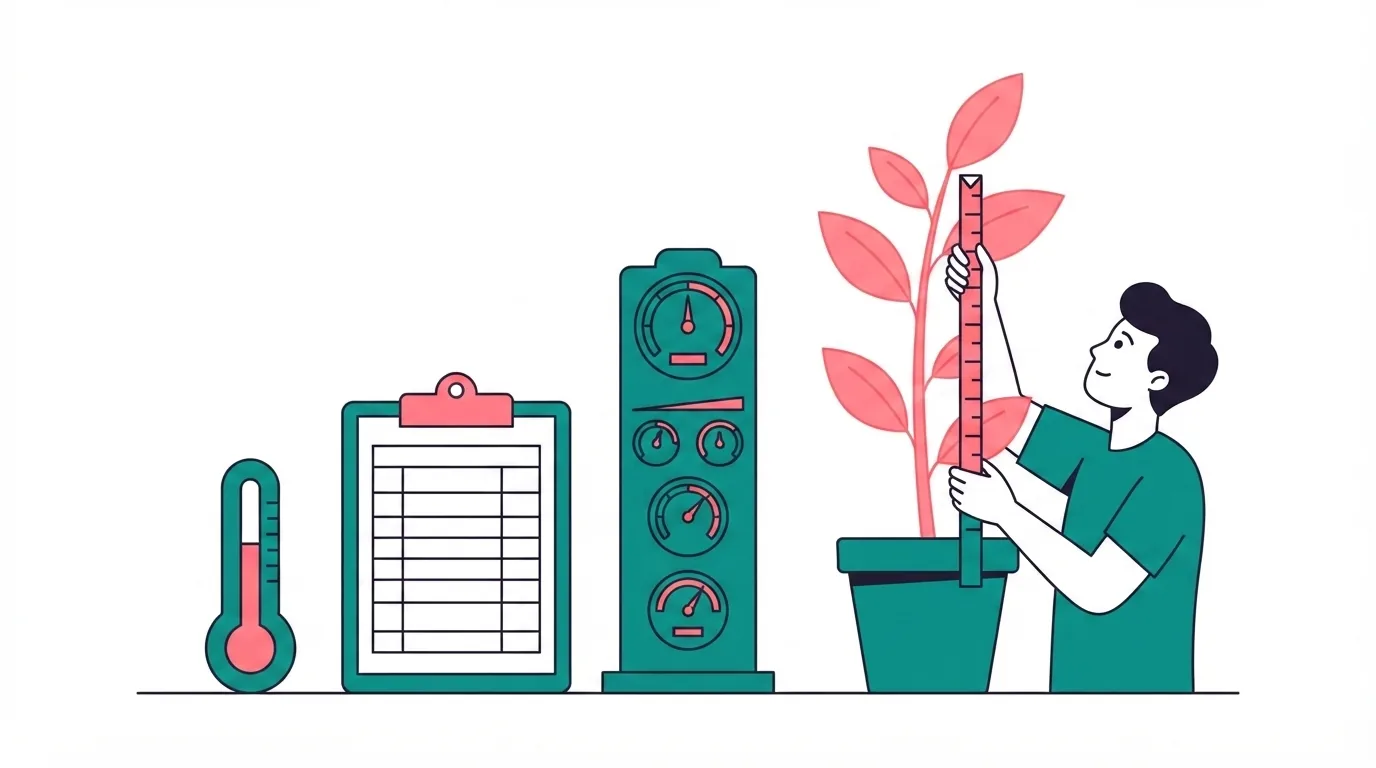
You can measure employee happiness. Not precisely, and not in a way that survives being turned into a target, but well enough to notice when something is going wrong and roughly where. That’s a genuinely useful capability and it’s worth setting up properly.
What follows is how to do it: what to pick, how to write questions that don’t quietly produce the answer you wanted, how often to ask, and how to read the result without fooling yourself. The last section is about the ceiling — the things a survey structurally cannot tell you, which matter as much as the things it can.
First, decide what you’re trying to learn
Almost every measurement problem starts here. “Measuring happiness” is three different jobs, and one instrument cannot do all three well.
- Trend detection. Is the overall picture better or worse than six months ago? You want one cheap question asked consistently over years. Precision doesn’t matter; consistency does.
- Diagnosis. Something is off — where? You want breadth: many items across many dimensions, so you can see that it’s manager quality in one team and workload in another.
- Event feedback. Did that specific thing work? You want narrow, immediate, and tied to a concrete experience.
Pick the job first. A team that wants trend detection and runs a 50-question diagnostic quarterly has bought a large amount of respondent fatigue for information it isn’t using.
Choosing the instrument
eNPS — one question, 0–10, “how likely are you to recommend working here.” Cheap, high response rate, trends cleanly. It is a blunt instrument measuring something closer to employer-brand pride than daily experience, and it will not tell you why anything moved. Good for job one, useless for job two.
A full engagement survey — 30–60 items across autonomy, manager quality, clarity, growth, recognition, belonging. Gallup’s Q12 is the well-validated short form and a reasonable starting point if you don’t want to build your own. This is your diagnostic. Run it annually, not quarterly.
A short pulse — one to five questions, tied to something specific. The post-event version is the format that consistently earns its response rate: two questions, sent within 48 hours, about a thing that just happened.
Mood check-ins — a daily or weekly emoji tap. Be honest about what you’re getting. Aggregate daily mood data is dominated by sleep, commutes and weather, and the temptation to treat every wobble as signal is strong. If you run one, look at it monthly.
A reasonable default for most teams: eNPS twice a year, one full survey annually, pulses around discrete events. That’s three instruments doing three jobs, and the total respondent burden is lower than a quarterly long-form.
Writing questions that don’t lie to you
Survey design is where most in-house instruments quietly break. The failures are consistent and easy to avoid.
Double-barrelled items. “I feel supported by my manager and my team” — someone with a great team and an absent manager cannot answer this. Every “and” in a question is a potential split. One idea per item.
Leading framing. “How much do you enjoy our weekly socials?” presupposes enjoyment and will get you a warmer answer than “How do you feel about our weekly socials?” This one is especially insidious because the person writing the survey usually built the thing being asked about.
Agreement bias. People tend to agree with statements presented to them, particularly when the survey feels like it comes from leadership. Mix positively and negatively worded items so agreement isn’t always the positive answer, and watch for respondents who answer identically down the whole column.
Scale design. Use five or seven points, label every point rather than just the ends, and keep the same scale across the whole instrument. Switching from a 5-point to a 10-point scale halfway through breaks people’s mental model and adds noise. Include a neutral midpoint — forcing a choice doesn’t produce a real opinion, it produces a coin flip.
Ask for at least one thing in free text. “What’s one thing that would make next month better?” will routinely tell you more than the entire quantitative section. It’s also the part most likely to be skipped when someone is trimming for length. Don’t trim it.
Keep it short enough that people finish it. Completion drops sharply with length, and the people who drop out are not a random sample — they’re the busiest and often the most frustrated, which biases your result cheerful.
Anonymity, and why it’s mostly theatre below a certain size
Every survey promises anonymity. At smaller headcounts that promise is frequently impossible to keep, and people know it.
If you have thirty people and you ask for department, tenure band, and manager, you have in many cases identified the respondent. Anyone thinking clearly about it will notice, and they’ll answer accordingly — which means your carefully designed instrument is now measuring how safe people feel being honest, layered on top of whatever you were trying to measure.
Two honest options. Either collect no demographics at all and accept that you can’t segment, or say plainly that responses are attributable and that the point is a conversation rather than a secret ballot. Both are defensible. What isn’t defensible is claiming anonymity you can’t deliver — that gets discovered exactly once, and afterwards every survey you run is measuring something other than what you think.
Use a third-party tool that genuinely aggregates, don’t look at raw submissions even when you could, and never respond to a specific comment in a way that reveals you worked out who wrote it. That last one has ended more survey programs than any design flaw.
Cadence
The most common mistake is measuring too often.
Quarterly full engagement surveys are the standard bad default. The marginal information over annual is small — organisational dynamics don’t turn over in ninety days — and the cost in goodwill is large, especially when the gap between survey and visible action is longer than the gap between surveys. That combination teaches people the exercise is decorative.
A workable rhythm: the long instrument annually, eNPS at the six-month mark, event pulses whenever there’s something concrete to learn. Add an off-cycle pulse after genuinely significant events — a reorg, a funding round, a layoff, a return-to-office change — because those are the moments where the number is actually informative and where waiting nine months to find out is negligent.
Response rate is data, not admin
Treat the response rate as a measurement in its own right, because it is one.
A rate that drops from 80% to 50% across two cycles is telling you something more important than anything in the results — usually that the previous round visibly produced nothing. It’s also a correctness problem: at 50%, the people who didn’t answer are systematically different from the people who did, and your average is measuring the engaged half.
Publishing what changed after the last survey does more for the next response rate than any number of reminder emails. It’s the only lever that reliably works, because it’s the only one that addresses the actual reason people stopped.
Reading the result without fooling yourself
Segment before you conclude. A flat company-wide average routinely hides one team in real trouble and one doing well. The company number is the least actionable figure in the report.
Trend beats absolute. Industry benchmarks vary so much by sector, geography and stage that comparing your 31 to someone’s published 45 tells you very little. Your own line over time is the reading that means something.
Don’t chase noise. A two-point move on a five-point scale with forty respondents is well inside normal variation. Set a threshold in advance for what counts as a real change, and hold to it, or you’ll spend the year reacting to sampling error.
Read the comments properly. Do it before you look at the scores — otherwise the numbers frame how you read the text. The free-text section is where the causal information lives; the quantitative part mostly tells you where to look.
Watch for the timing effect. A survey run three weeks after a good offsite and one run three weeks after a difficult all-hands are measuring the same underlying reality and will not agree. Keep timing consistent relative to your own calendar, and note the context on the result when you can’t.
The ceiling
Here’s what the instrument structurally can’t do, however well you build it.
A survey is good at detecting that something is wrong and roughly where. It is bad at telling you what would make things better. Those are different capabilities, and the second one isn’t hiding in the data waiting to be found with better analysis — it isn’t there.
The mechanism is straightforward. Every one of these instruments asks people to compress a working life into a scale, in the abstract, on a schedule someone else set. But the underlying judgment is assembled from specific things: whether anyone noticed you were struggling, whether your five-year anniversary was marked or passed unremarked, whether the colleague who left got a proper send-off. People don’t hold a running sentiment score. They remember a handful of concrete moments and answer from those.
So the score is a lagging indicator of something built somewhere else. Measure — it’s genuinely useful as a smoke alarm and it will catch problems you’d otherwise miss by months. Just don’t confuse the alarm for the building. What actually moves the underlying thing is a different problem with a different toolkit, and the honest version of the productivity argument that usually gets attached to it is here.
One practical note on the event-scoped end of this, since it’s the piece most teams skip: asking two questions right after something concrete happened — an offsite, an all-hands, a team week — reliably produces more usable information per unit of respondent patience than any periodic instrument. It’s narrow by design. That’s the feature. TeamRally sends that pulse automatically after an event and shows you the answers, which is the only measurement we do and the only one we intend to.
No happiness score, no leaderboard, no dashboard rating human beings. TeamRally runs your team’s celebrations and events, and asks two questions afterwards. Free up to 15 people — start free.